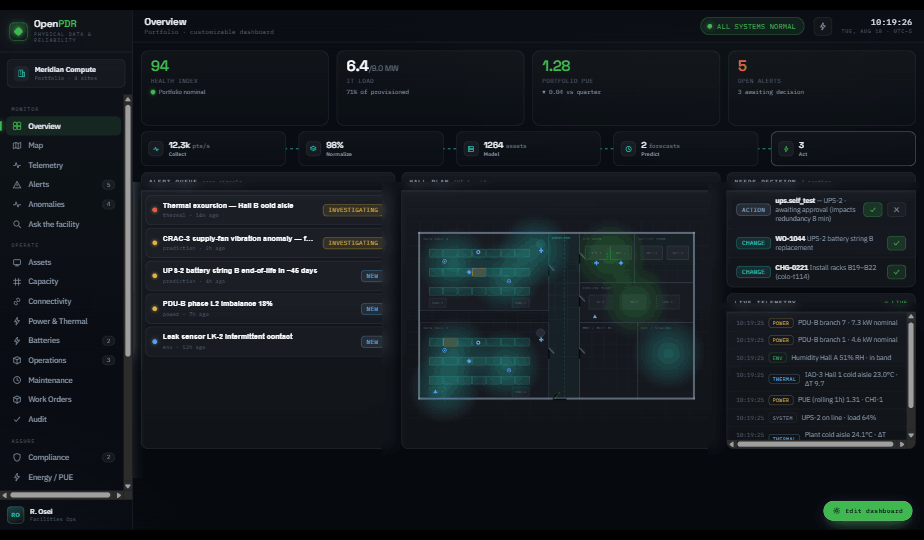
OpenPDR unifies live telemetry, failure prediction and audit-grade evidence for datacenter and colo operators — from the utility feed to the rack.

Every screen below is the live product — portfolio down to a single sensor.
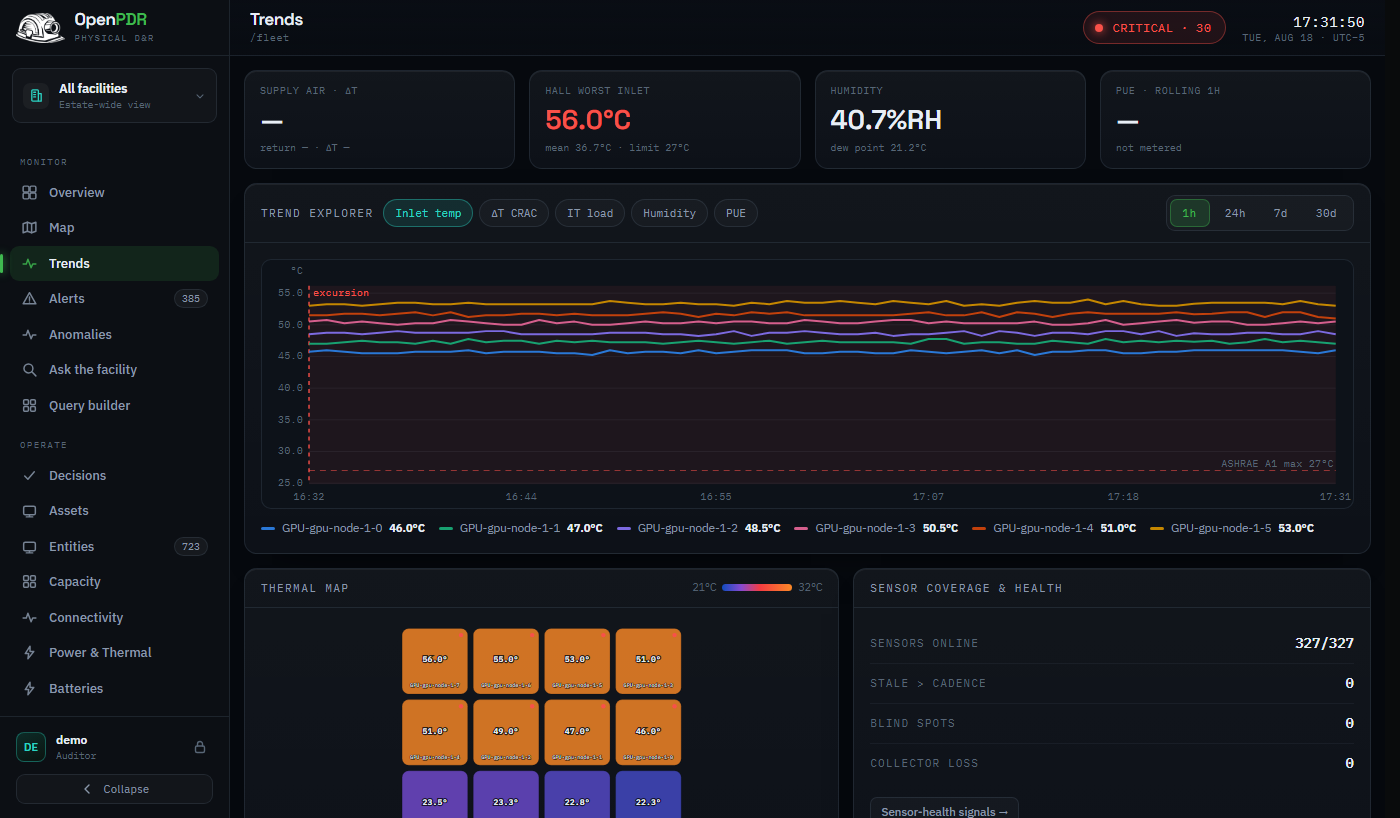
Trend any metric across the portfolio — inlet temps, ΔT, IT load, humidity, PUE — with thresholds, incident annotations and a live thermal map of every hall.

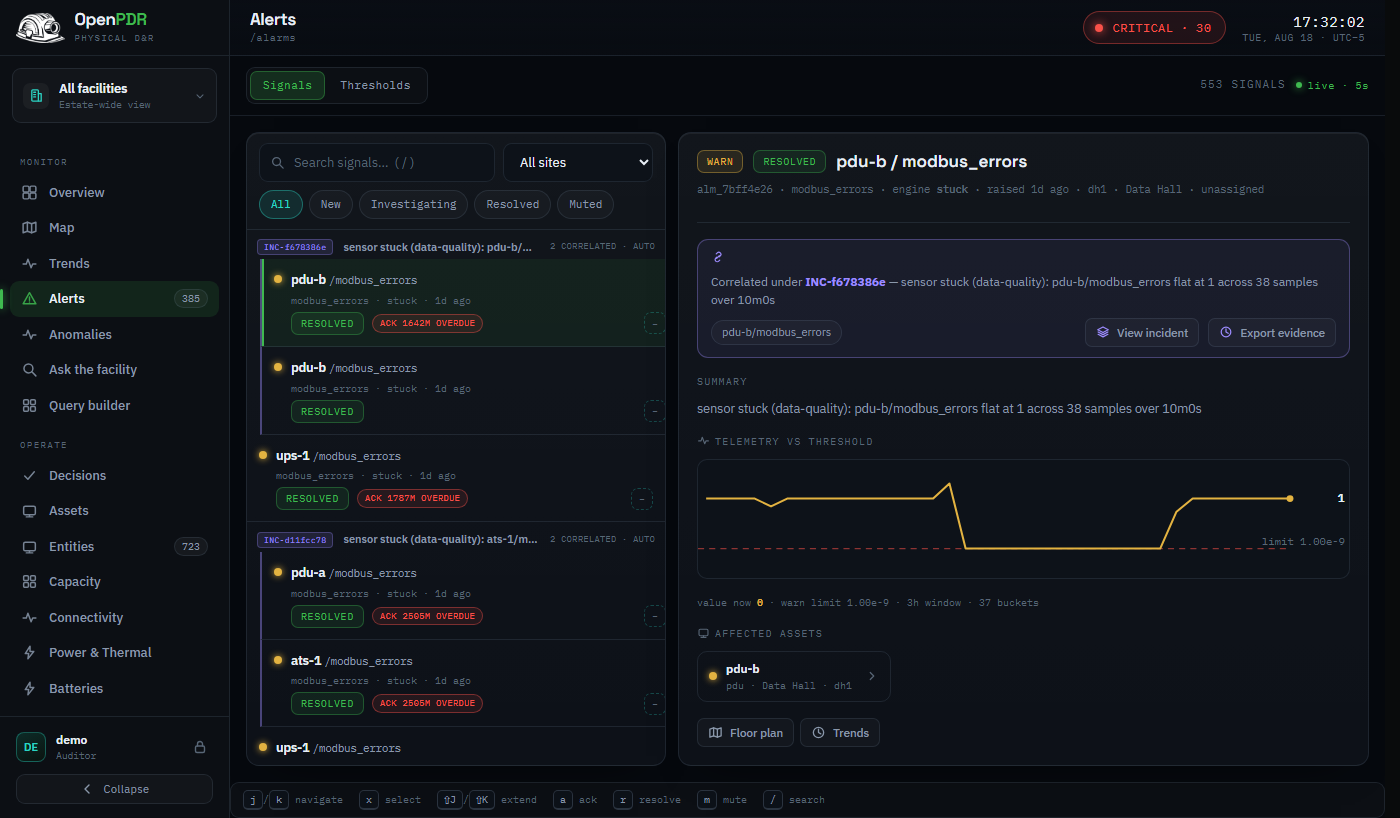
Predictive and rule-based alerts with SOC-style triage: SLA acknowledgement, auto-clustering of related signals, root-cause disposition and a sealed evidence record on every one.

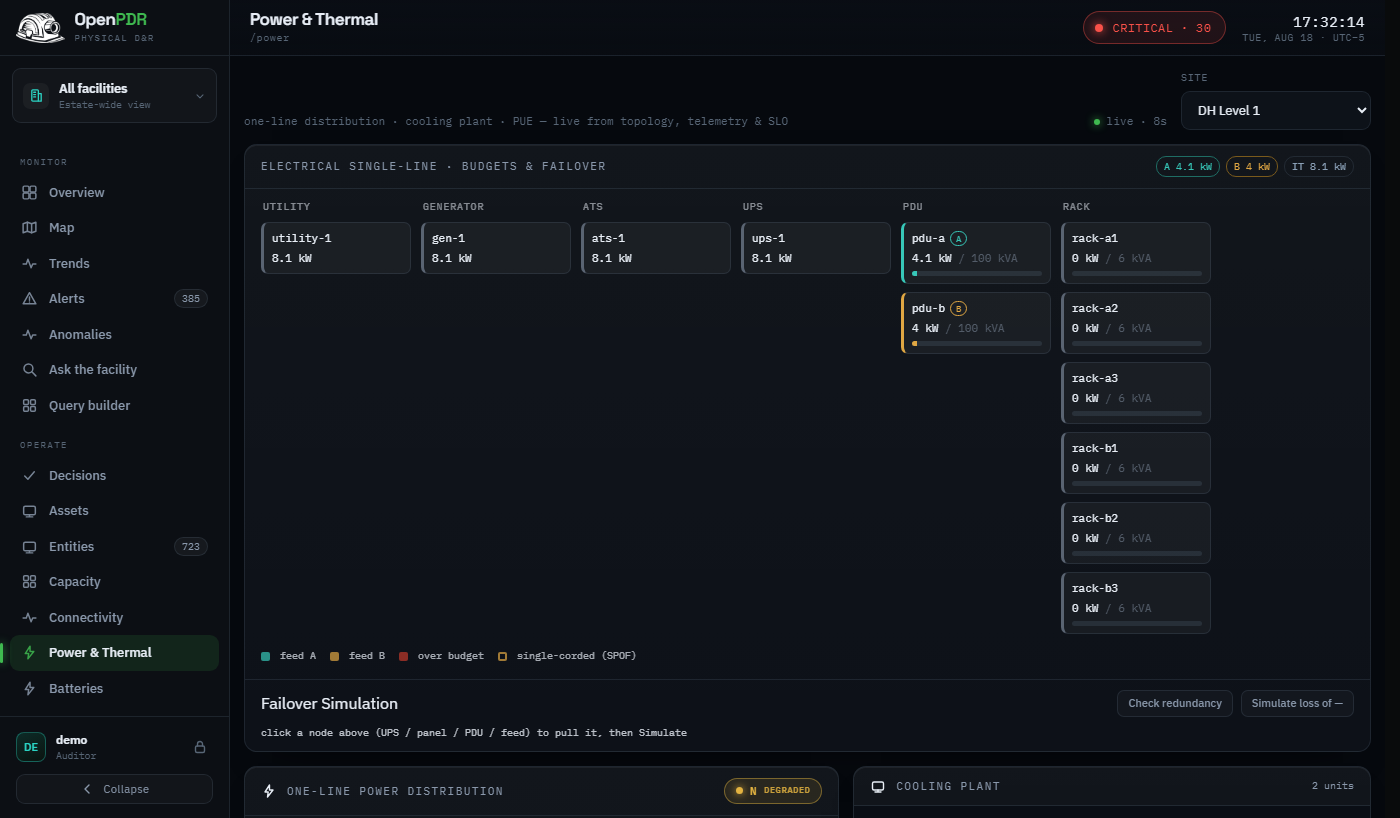
A live one-line diagram from utility feeds through ATS, UPS and PDU to the rack — with redundancy state, load per node and a dependency graph that answers “what does losing this feed?”

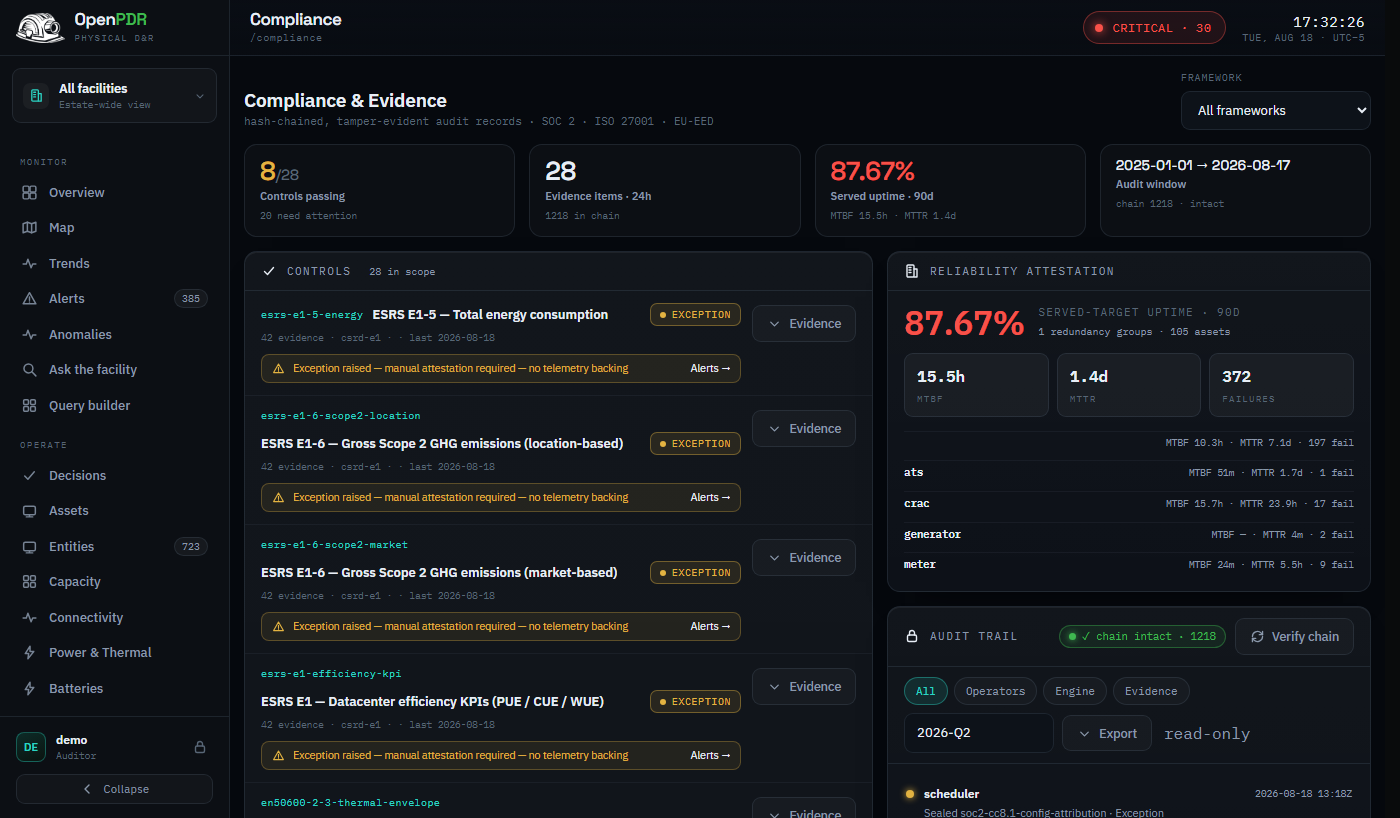
Controls for SOC 2, ISO 27001 and EU EED map directly to live telemetry. Evidence collects itself; the audit trail is immutable and hash-chained; exports are auditor-ready.

One pipeline runs the whole product. Every stage leaves an audit entry.
SNMP v3, BACnet/IP, Modbus TCP and Redfish collectors stream from meters, CRACs, UPSes and sensors.
Readings become typed telemetry bound to assets, halls and circuits in one model.
Power chains, cooling domains and capacity are modeled as a live dependency graph.
Battery EOL, thermal drift and capacity exhaustion surface as signals before they bite.
Runbooks respond — auto or with approval — and every action lands in the hash-chained trail.
Evidence is a by-product of operating, not a fire drill.
A1.1–A1.3 and CC7.2 evidenced continuously from sensor telemetry and CRAC/UPS events.
A.11.2.2 / A.11.2.4 control status tied to feed, UPS and HVAC continuity data.
PUE reporting per Article 11 and tier-style MTBF / MTTR attestation, generated from the record.
The demo console runs a full synthetic estate — six halls, live telemetry, real alerting. Tell us where to send access and we'll set you up.